
Hosted Slicers (Legacy)
Uplynk’s Hosted Slicers solution has reached its end of life, and was shut down on June 30th, 2025. Hosted Slicers has been replaced with a completely rewritten Cloud Slicers solution. Cloud Slicers are easier to use, more stable and have a richer feature set. Start using Cloud Slicers today.
Hosted Slicers allows you to run a slicer in our cloud. This allows you to ingest and encode content without on-premise hardware. You may customize this slicer in the following ways:
- Choose an ingest point that defines where it will be hosted and the streaming protocol for the audio / video feed that will be ingested.
- Select the version of the slicer software that it will run.
- Define a slicer configuration that determines how the audio / video feed will be ingested and processed.
Create and delete slicers as required by your business needs.
Quick Start
Set up a streaming workflow by performing the following steps:
-
Create an Ingest Point in the region where your Hosted Slicer will be hosted.
-
Create a Hosted Slicer in the same region as the above ingest point.
-
Add Hosted Slicer to the desired live channel, live event, or failover group.
-
Push Video Feed from your encoder to the ingest point created in step 1.
-
Point Your Player to your live channel or live event's playback URL.
Ingest Point Administration
An ingest point identifies a URL and ports to which an encoder should push an audio/video feed.
Upon creating a Hosted Slicer, you must associate it with an ingest point from which it will ingest an audio/video feed.
Key Information
- An ingest point is restricted to a specific region and streaming protocol.
- An ingest point can be in either of the following states:
- IN_USE: This state indicates that it has been associated with a Hosted Slicer.
- NOT_IN_USE: This state indicates that it is available for assignment to a Hosted Slicer.
- Deleting a Hosted Slicer changes the state of the ingest point that was associated with it from IN_USE to NOT_IN_USE. This allows you to reuse the same ingest point with a different Hosted Slicer.
Create an Ingest Point
- Navigate to Ingest Points: From the main navigation, go to Slicers > Ingest Points.
- Click + Ingest Point.
- In the Endpoint Name option, assign a name to the ingest point.
- In the Type option, select the streaming protocol for the feed that will be ingested.
- In the Region option, select the region where the Hosted Slicer that will ingest this feed will be hosted.
- Optional: In the Endpoint Description option, type a description for this ingest point.
- Click Create.
Modify an Ingest Point
- Navigate to Ingest Points: From the main navigation, go to Slicers > Ingest Points.
- Click on the desired ingest point.
- In the Name option, modify the name assigned to this ingest point.
- Optional: In the Description option, modify the description assigned to this ingest point.
- Click Save.
Delete an Ingest Point
- Navigate to Ingest Points: From the main navigation, go to Slicers > Ingest Points.
- Check the ingest point's status:
- IN_USE: You cannot delete an ingest point that is in this state. You must first delete the Hosted Slicer associated with it.
- NOT_IN_USE: Proceed to the next step.
- Click on the desired ingest point.
- Click Delete Ingest Point.
- Click Yes > Delete to confirm the deletion.
Cloud Slicer Live Administration
Before creating a Hosted Slicer, you must first perform the following steps:
-
Identify the Region (e.g., Oregon or Ohio) where your Hosted Slicer will be created.
-
Identify the Streaming Protocol through which your feed will be published to a Hosted Slicer. A Hosted Slicer supports the following protocols:
RTP | RTMP | SRT | RIST
- Create an Ingest Point point within the region identified in step 1.
Key Information
-
You may assign a custom slicer configuration to your Hosted Slicer. You can define this custom configuration by:
- Importing settings from a file
- Manually adding settings
- A combination of both
-
You may import settings from a file. We support the following formats:
-
Text File: Import a file that uses the same format as a Live Slicer configuration file. Specify each desired setting on a separate line.
-
JSON: Import a file containing settings defined as key-value pairs using JSON notation.
-
-
Our service manages certain slicer configuration settings. You should not manually assign these reserved settings to your Hosted Slicer.
Create a Hosted Slicer
-
Navigate to Hosted Slicers: Go to Slicers > Hosted Slicers from the left navigation of the main page.
-
Click + Create Slicer.
-
From the Ingest Point section, select an ingest point that corresponds to the region where this slicer will be hosted and the streaming protocol for the feed that it will ingest.
- Click Select Ingest Point.
- Select the ingest point that will be assigned to the Hosted Slicer.
- Click Save.
- RTP, SRT, and RIST
- In the Source IP Address option, type the IP address from which your feed will be pushed. Our service will only ingest feeds served from this IP address. Allow your feed to be pushed from any IP address by setting this option to
0.0.0.0. - Regardless of how this setting is configured, the encoder pushing the feed to our service must authenticate to our service by passing the Hosted Slicer's streaming key.
Learn more.
- In the Source IP Address option, type the IP address from which your feed will be pushed. Our service will only ingest feeds served from this IP address. Allow your feed to be pushed from any IP address by setting this option to
-
From the Slicer Software Version section, assign a slicer software version to the Hosted Slicer.
-
Click Select Version.
-
Select the desired slicer version.
-
Click Save.
-
-
Optional: From the Encoding Profile section, select the encoding profile that will be assigned to the Hosted Slicer.
- Click Change Profile.
- Select the encoding profile that this Hosted Slicer will use to encode content.
- Click Save.
-
Optional: From the Slicer Configuration section, import, add, or remove slicer settings.
- Define this slicer's ID through the
slicerIDsetting. - Click Customize.
- Optional: Import slicer configuration settings.
- Optional: Add or remove settings as needed.
- Click Save.
- Define this slicer's ID through the
-
Optional: From the Slicer Notes option, briefly describe the purpose of this Hosted Slicer.
-
Click Create.
Modify a Hosted Slicer
-
Navigate to Hosted Slicers: Go to Slicers > Hosted Slicers from the left navigation of the main page.
-
Click on the desired Hosted Slicer.
-
Update this Hosted Slicer as needed.
- Optional: From the Slicer Configuration section, review your slicer configuration. Import, add, or remove slicer settings as needed.
- Define this slicer's ID through the
slicerIDsetting. - Click Customize.
- Optional: Import slicer configuration settings.
- Optional: Add or remove settings as needed.
- Click Save.
- Define this slicer's ID through the
- Optional: From the Slicer Version section, update the Hosted Slicer's slicer version.
- From the Additional Details section, add, modify, or delete notes as needed.
- Optional: From the Slicer Configuration section, review your slicer configuration. Import, add, or remove slicer settings as needed.
-
Click Save.
-
Changes to your Hosted Slicer's slicer configuration require restarting your Hosted Slicer. Restart your Hosted Slicer.
Customize a Hosted Slicer
You can import existing slicer configuration settings or adjust a slicer's settings.
Import Slicer Configuration Settings
-
Click + Import.
-
Set the Source option to File. Select the desired file:
- Click Browse
- Navigate to the directory that contains the desired slicer configuration file
- Select the file
- Click Open
-
From the Import Mode option, choose one of the following:
-
Append after configuration settings: Choose this option to place all of your imported settings below your existing slicer configuration settings.
-
Prepend before configuration settings: Choose this option to place all of your imported settings above your existing slicer configuration settings.
-
Replace all configuration settings: Choose this option to remove all of your existing slicer configuration settings and replace them with your imported settings.
-
-
Click Import File.
Add or Remove Settings
-
Add a setting
-
Click + Custom. Alternatively, add a commonly used setting by clicking + Standard instead.
-
In the Key option, type the name of the desired Live Slicer configuration setting.
-
In the Value option, assign a value to that setting.
-
Click Add Custom Setting.
-
-
Remove a Setting
-
Mark the settings you want to remove.
-
Click x Remove.
-
Delete a Hosted Slicer
- Navigate to Hosted Slicers: Go to Slicers > Hosted Slicers from the left navigation of the main page.
- Click on the desired Hosted Slicer.
- Click Delete Hosted Slicer.
- When prompted, click Delete to confirm the deletion.
Restart a Hosted Slicer
- Navigate to the Slicers page.
- Click on the desired Hosted Slicer.
- Click Restart Hosted Slicer.
- Click Restart to confirm this action.
Slicer Status Information
Use a Hosted Slicer's status to find out whether it is ready to stream your content. Core Hosted Slicer statuses are described below:
- pending: Indicates that our service has not started provisioning your Hosted Slicer.
- initializing: Indicates that our service is in the process of creating your Hosted Slicer.
- created: Indicates that your Hosted Slicer has been created, but is not in use.
- running: Indicates that your Hosted Slicer is active. An active Hosted Slicer can be in any of the following states: capture, replace, ad, or blackout.
- failed: Indicates that our service could not create your Hosted Slicer.
Reserved Slicer Configuration Settings
You may not use the following settings with a Hosted Slicer:
api_port | apikey | capture_delay | multicast | no_signal_image | no_signal_pad | port | rtmp_url | rtp_backlog_dur | rtp_headers | rtp_readahead_dur | ssl_port | username
Slicer Configuration File
You may import a slicer configuration file when defining your Hosted Slicer's slicer configuration. You may format this slicer configuration file using either colon-separated values or JSON.
Colon-Separated Values (Live Slicer Configuration File)
You may define slicer configuration settings using the same format as a Live Slicer configuration file. Specify each desired setting on a separate line.
Syntax: "{Setting}": "{Value}"
Example:
remote:on
description:Sports
input:rtmp
autoexpire_age:3
slicerID:sports_slicer
JSON
You may define slicer configuration settings using JSON format. Define each slicer configuration setting as a key-value pair using JSON notation.
Syntax: "{Setting}": "{Value}"
Example:
{
	"remote": "on",
	"description": "Sports",
	"input": "rtmp",
	"autoexpire_age": "3",
	"slicerID": "sports_slicer"
}
Encoder
Your encoder must push an audio/video feed to an ingest point. If you have assigned that ingest point to a Hosted Slicer, then that Hosted Slicer will automatically encode your content.
Our service will only ingest your feed when the following conditions are met:
-
Encoder Configuration: Your encoder is configured to push an audio/video feed to the Hosted Slicer's streaming URL.
Sample publishing URL:
rtmp://ingest-prod-1-us-east-1.mss.aws.oath.cloud/slicer12345 -
RTP, SRT, and RIST: Your encoder's IP address matches the one defined in the ingest point's Source IP Address option.
-
SRT Only: You must configure your encoder to pass the Hosted Slicer's streaming key along with your feed. This configuration varies by encoder. If your encoder does not provide a password option when defining an SRT publishing target, then you should include the
passphrasequery string parameter in the publishing URL.Syntax:
?passphrase=Streaming KeySample publishing URL:
srt://ingest-prod-1-us-east-1.mss.aws.oath.cloud:48120?passphrase=7b4777ca-c0de-410b-913e-a011607ef525
Link Health Monitoring
A link is established when an encoder starts pushing an audio/video feed to an ingest point. Hosted Slicer performance relies on this link, and therefore, we track key link health metrics. These metrics are measured by:
-
Session: Provides link health, aggregated in some cases, from the moment the link was established. Use session statistics to assess the overall health of the link between the encoder and the Hosted Slicer.
-
Recent Interval: Provides the most recent link health measurement. Use these statistics to identify recent trends (e.g., link health improvements or degradation).
View these metrics from within the Link Monitor section of the desired Hosted Slicer.
| Name | Description |
|---|---|
| Round Trip Time | Indicates the round trip time between the encoder and the Hosted Slicer in milliseconds. |
| Link Uptime | Indicates the duration, in hours, for the connection between the encoder and the Hosted Slicer. |
| Latency Setting | Indicates the length of time, in milliseconds, that the Hosted Slicer will wait before processing data packets. This delay provides time for packet correction to take place. |
| Stream Bitrate | Indicates the rate, in Kbps, at which data is being transferred from the encoder to the Hosted Slicer. |
| Packets Inbound | Indicates the number of data packets received by the Hosted Slicer. |
| Packets Outbound | Indicates the number of data packets sent to the encoder by the Hosted Slicer. |
| Percent Link Success | Indicates the percentage of data packets that were successfully received by the Hosted Slicer. |
| Packets Errored | Indicates the number of data packets that were not successfully delivered. |
| Percent Errored | Indicates the percentage of data packets that resulted in an error. |
| Packets FEC Corrected | Indicates the number of data packets that were successfully delivered after being corrected by Forward Error Correction (FEC). |
| Percent Fixed by FEC | Indicates the percentage of data packets that were successfully delivered after being corrected by Forward Error Correction (FEC). |
| Packets ARQ Corrected | Indicates the number of data packets that were successfully delivered as a result of automatic repeat request (ARQ). |
| Percent Fixed by ARQ | Indicates the percentage of data packets that were successfully delivered as a result of automatic repeat request (ARQ). |
| ARQ Requests | Indicates the number of requests that triggered ARQ. |
| ARQ Fails | Indicates the number of requests that were unsuccessful after triggering ARQ. |
| Percent Failed ARQ | Indicates the percentage of requests that were unsuccessful after triggering ARQ. |
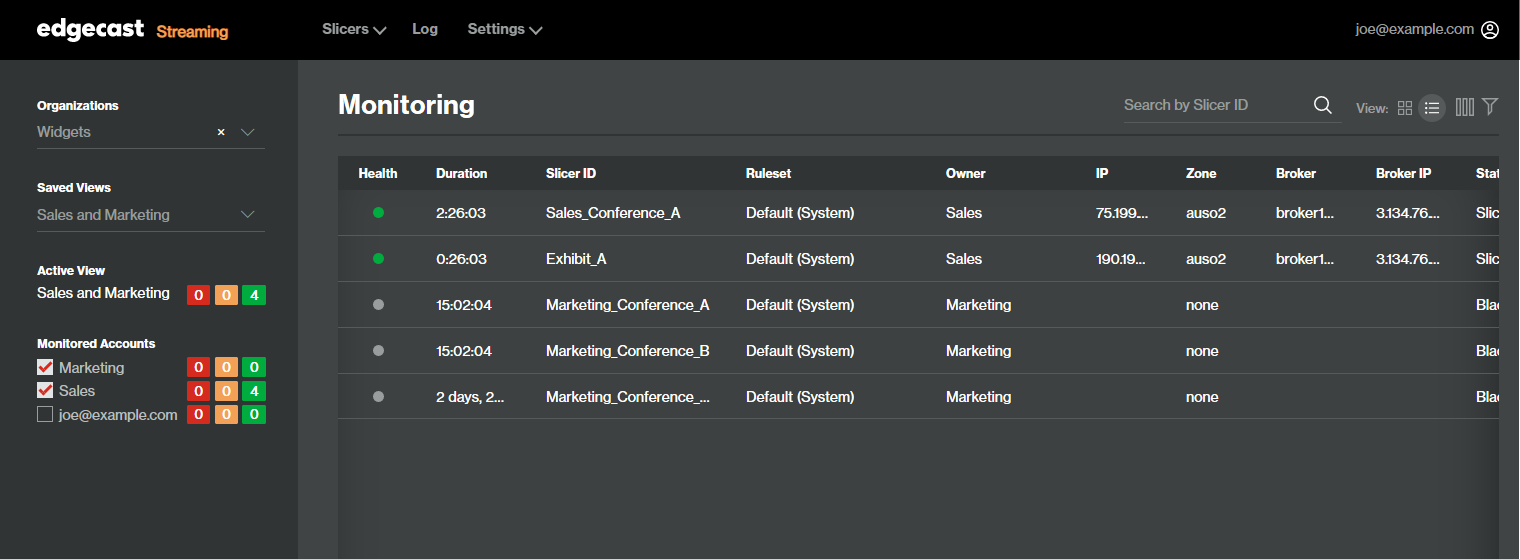
Dashboard
The Live Slicer Monitoring dashboard provides statistics and graphs that describe Live Slicer health.
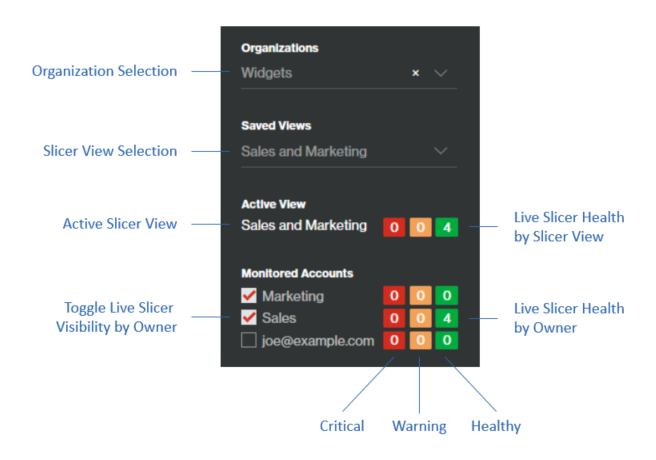
The left pane
- Determines whether you will view the Slicer View(s) associated with your personal user account or your organization's shared ones.
- Allows you to switch to a different Slicer View.
- Indicates the current Slicer View and the number of Live Slicers associated with it by health status.
- Toggles Live Slicers from the dashboard by owner. For each owner, it also indicates the number of Live Slicers by health status.
The right pane provides the following information and statistics for each Live Slicer associated with the current Slicer View.
Column Name | Description |
|---|---|
Health | Indicates Live Slicer health via the following color-coded icons:
|
Duration | Indicates the amount of time that the Live Slicer has been in the current health state. |
Slicer ID | Indicates a Live Slicer's ID. This ID is defined by the slicerID parameter in the Live Slicer's configuration file. |
Ruleset | Indicates the ruleset used to determine the state of Live Slicer health. |
Owner | Identifies the name of the user that owns the Live Slicer. |
IP | Indicates the Live Slicer's IP address. |
Zone | Indicates the zone to which the Live Slicer is pushing content. |
Broker | Identifies the name of the broker handling the Live Slicer's content. |
Broker IP | Indicates the IP address of the broker handling the Live Slicer's content. |
State** | Indicates the Live Slicer's current state:
|
Signal | Indicates the input signal type:
|
Luma | Indicates the average luminosity percentage for the last few seconds of video. This percentage will only be returned when the Live Slicer has reported a luma value. |
Vol | Indicates the average loudness percentage for the last few seconds of audio. This percentage will only be returned when the Live Slicer has reported a volume value. |
CCLS | Indicates the number of seconds since the Live Slicer received the most recent caption. |
NTLS | Indicates the number of seconds since the Live Slicer received the most recent Nielsen tag. |
SCTELS | Indicates the number of seconds since the Live Slicer received the most recent SCTE signal. |
PB | Indicates the number of packets that are queued to be read by the Live Slicer. |
DF | Indicates the number of dropped frames. |
UQ | Indicates the number of slices that are awaiting to be uploaded. |
CPU | Indicates the percentage of CPU usage for the computer hosting the Live Slicer. CPU usage is reported for 1 second, 5 seconds, and 15 seconds ago. |
OS | Indicates the operating system for the computer hosting the Live Slicer. |
Real MEM | Indicates the amount of physical memory, in MB, used by the Live Slicer. |
Virt MEM | Indicates the amount of virtual memory, in MB, used by the Live Slicer. |
Key Information
By default, all Live Slicers that have been associated with the currently selected Slicer View and that have been active within the last 24 hours are displayed on the dashboard. This list may be filtered by Live Slicer ID, health status, or account owner.

- Filter by Live Slicer ID: Type the desired ID and then press the Enter key.
- Filter by Live Slicer health status: Click the health status filter icon
 , mark and/or clear the desired statuses, and then click off of it to hide the popup.
 - Choose Columns: Select the set of columns to be displayed by clicking the columns icon
 .
. - View Detailed Information: Clicking on a Live Slicer provides more detailed information about that Live Slicer and its health. This detailed view is known as Live Slicer Details.
Live Slicer Details
View more detailed health information by clicking on a Live Slicer.
- Health Measurement: Live Slicer health is measured according to its current ruleset. View and/or set a Live Slicer's ruleset from the pane on the right-hand side of the window.
- Assign Rulesets: Assign rulesets to one or more Live Slicer(s) from the Monitoring Rules page.
- Set Profile: View and/or set the profile that determines when the Live Slicer will push health data to Amazon SNS or trigger audio notifications from the pane on the right-hand side of the window.
This mode consists of the following four views: Slicer Snapshot, Charts, Health Details, Status.
Slicer Snapshot
This view consists of the following sections:
- Preview: Displays a thumbnail preview of the Live Slicer's output. The output for this preview varies according to its state.
- Slicing: Displays recently sliced content.
- Ad Break: Displays a message indicating that the thumbnail is unavailable.
- Replacing Content: Displays a message indicating that the thumbnail is unavailable.
- Blackout: Displays a message indicating that the thumbnail is unavailable.
- Offline: By default, green frames are shown whenever the signal is lost. Black frames or an image may be shown instead when either the
no_signal_pador theno_signal_imagesetting is defined.
- Health Level: Indicates the Live Slicer's current health status and the duration that it has been in that state.
- Slicer Status: Indicates the Live Slicer's status and the duration that it has been in that state.
- Health -{Ruleset}: Displays historical health status for the current Live Slicer. The line graph's title indicates the ruleset through which health status was determined.
Charts
This view graphs historical statistics for key metrics. Click on a metric to view its line graph.
Each metric is color-coded to indicate health status:
 Healthy: Indicates that all monitored metrics are below warning thresholds.
 Neutral: Indicates that the Live Slicer is not slicing content.
 Warning: Indicates that one or more monitored metrics are at warning levels.
 Critical: Indicates that one or more monitored metrics are at critical levels.
Some of the metrics reported in this view may be responsible for determining Live Slicer health status in multiple ways. This relationship is explored below.
| Metric | Description |
|---|---|
| Signal | Indicates the input signal type. Health status is determined by Signal Status. |
| Luminosity | Indicates the average luminosity percentage for the last few seconds of video. This percentage will only be returned when the Live Slicer has reported a luma value. Health status is determined by Black Video and Static Video. |
| Volume | Indicates the average loudness percentage for the last few seconds of audio. This percentage will only be returned when the Live Slicer has reported a volume value. Health status is determined by Loss of Audio and Static Audio. |
| Closed Captions | Indicates either the number of seconds since the Live Slicer received the most recent caption or None if closed captions have never been received. Health status is determined by Closed Captions Last Seen. |
| Nielsen Tag last seen | Indicates the number of seconds since the Live Slicer received the most recent Nielsen tag. Health status is determined by Nielsen Tag Last Seen. |
| SCTE last seen | Indicates the number of seconds since the Live Slicer received the most recent SCTE signal. Health status is determined by SCTE Last Seen. |
| Processing backlog | Indicates the number of packets that are queued to be read by the Live Slicer. Health status is determined by Processing Backlog. |
| Dropped Frames | Indicates the number of dropped frames. Health status is determined by Dropped Frames. |
| Upload Queue | Indicates the number of slices that are awaiting to be uploaded. Health status is determined by Upload Queue. |
| Extended Ad Break | Indicates duration of the current ad break in seconds. Health status is determined by Extended Ad Break. |
Health Details
This view provides detailed Live Slicer health for a given timestamp.
- Details: Identifies the timestamp for the current set of health data and the amount of time that the Live Slicer has been in the current state.
- Metrics: Provides health data for each metric. Specifically, each row identifies a metric, its health status at the time identified in the Details section, and a brief description of the last time that this metric's health status changed.
Status
This view provides metric data for a given timestamp.
- Details: Identifies the timestamp for the current set of health data.
- Status JSON: Provides detailed Live Slicer information, including metrics, in JSON format.
- Metrics: Provides data for each metric.
Alert Log Data
The Alert Log page displays log data for alerts generated for the current Live Slicer over the specified date range. Leverage this historical data to discover trending issues and adjust warning/critical alert levels.
- Alert log data is paginated and limited to 10,000 entries. If you encounter this limitation, adjust your filters (e.g., reduce the time window or only show changes in health status) to reduce the number of entries.
- Alert log data is displayed in reverse chronological order (i.e., newest to oldest event).
- Log alerts are triggered according to the ruleset(s) assigned to your Live Slicer(s).
Key Information
Filter log data by:
- Health Status: Mark or clear the desired health status(es).
- Status Change: Filter log data to only show changes in a Live Slicer's health status by marking the Show changes in health only option.
- Time: Specify the date range for which log data will be shown by setting the From and To options and then clicking Apply.
The following information is provided for each logged alert:
| Column Name | Description |
|---|---|
| Slicer ID | Indicates a Live Slicer's ID. This ID is defined by the slicerID parameter in the Live Slicer's configuration file. |
| Account | Identifies the name of the user that owns the Live Slicer. |
| Previous | Indicates the Live Slicer's health status immediately prior to the point-in-time identified by the Timestamp column. |
| Current | Indicates the Live Slicer's health status at the point-in-time identified by the Timestamp column. |
| Created Date | Indicates the relative time that has elapsed since the log event took place. |
| Timestamp | Indicates the date and time (UTC) at which the log event took place. |
| Problem Metrics | Indicates zero or more metrics that caused a warning or critical health status. |
Common Tasks
- View Log Data: View the Alert Log page by clicking Log from the Live Slicer Monitoring dashboard.
- Refresh Log Data: View log events that have occurred since the start of your browsing session by clicking Apply.
- Filter Log Data: Filtering options are provided on the left-hand side of the page.
- Navigate Log Data: The Alert Log page can display up to 15 alert events. View older alerts by clicking on one of the following:
- �� First: Navigates to the first page.
- Previous: Navigates to the previous page.
- Page_Number: Navigates to a specific page.
- Next: Navigates to the next page.
- Last »: Navigates to the last page.
Updated 7 months ago